
Fujimoto, Yu, Doshisha University, Japan, yfujimoto@doshisha-bkj.net
Introduction
In 2009, Nara University auctioned its full set of ‘National Geographic Magazine (NGM)’, complete back to its first release in 1888. In response to the event, faculty and student devotees of the magazine launched a small working group in June of 2011. Although in the beginning the working group was satisfied with simply browsing the magazines, as discussion continued, members soon recognised academic importance of the collection.
Since magazines are generally driven by the mass interests of their readerships in order to raise their sales, shifting social conditions would become clear by observing variation in themes and physical information content over time in weekly or monthly magazines. In the case of NGM, its readers are mainly drawn from the intellectual classes, which can be thought to effect on global politics disproportionally, and the magazine covered a vast range of cultural and natural themes for more than 120 years.
Because NGM possesses all these characteristics, the author predicts that social conditions since the end of 19th century would become clear through appropriate analyses. Although the working group’s goal is to identify position of ‘Japan’ in global society from the 1890s to the 1950s as seen through NGM, the author focuses on deepening understanding of the magazine itself by analysing how it has changed overtime. In this paper, the author reports on the shift in the physical amount of information over time as the one of the preliminary analyses employing mathematical methods.
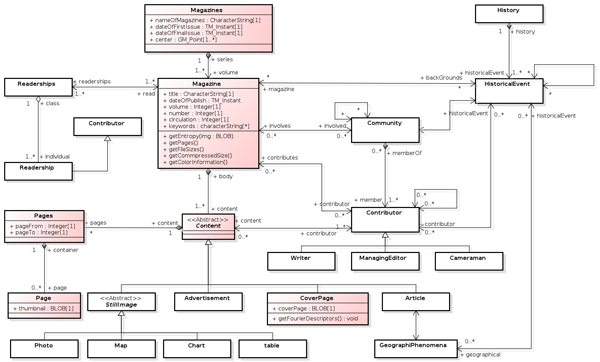 Figure 1: Conceptual schema for NGM research.
The research material
NGM has appealed to people all over the world since its first release in 1888 (Hubbard 1888), and Japan has been the focus of an issue’s main article more than 90 times since its first appearance in 1894 (Stevens 1894). Some important Japanese historical figures also commented on Japan since then. Additionally, the magazine always took a neutral stance, and even during World War II, conditions in Japan were described objectively; Japan was described as a strong rival to the United States rather than an evil state (Price 1942). Many of photos and illustrations, which are also important characteristics of the magazine, are further significant for Japanology since a huge amount of important materials vanished in 1923 during the great earthquake in Tokyo, and again in 1945 during the American firebombing of Tokyo.
Currently, the working group is planning the 3 phases of research to analyse the ‘Japan’ described in the magazine. The preliminary phase aims to understand the magazine itself, the resource acquisition phase archives various information concerning the magazine, and the analytical phase attempts to identify position of ‘Japan’ in global society from the 1890s to the 1950s from new standpoints. Overall, processes should be based on informatics not to put Japanese feelings in historical facts.
In order to understand the position of ‘Japan’ in global society through studying NGM, first, the characteristics of the magazine itself should be clarified. Therefore, the author designed an entire conceptual schema as a guide line for the project. Figure 1 is the schema that the author draw at the outset of this project. The following sections in this paper reports the results of operations defined on the ‘Magazine’ class and related classes highlighted in the schema. The author gave much attention to temporal shift in the information content as reflected in ocular information. Analysis of information content used the DVD version of the digital archive, published by the National Geographic Society, which includes all of the articles since the first issue in 1888 (National Geographic Society, 2010). Many devotees of the magazine enjoy the photographs and ’browse’ pages rather than ’read’ articles, and the series of analyses in this paper reflect this tendency.
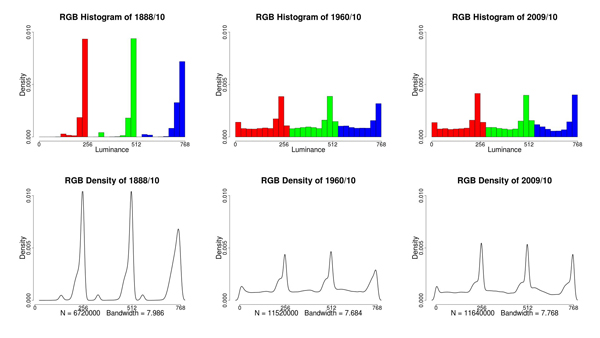 Figure 2: Histogram and density plot of colour use
Analyses
Although file size would be an adequate index for the amount of information, as well as the easiest approach, the author chose to also analyse the use of colours and entropy of thumbnails in each volume. The first processes consisted of randomly extracting constant numbers of pixel-values 4,096 times from each page to justify the size of the thumbnails, and in parallel, counting the number of pages in each volumes. After those processes, Normalised Colour Values (NCV) files, which consist of RGB values in each volume, were created. The NCV files were assigned a range of values from 0 to 767, and divided into three frequencies: red values were assigned from 0 to 255, green values were assigned from 256 to 511 and blue values were assigned from 512 to 767.
In this study, NCV files were programmatically created for both full pages and cover pages, and shapes of the colour usage distribution of cover pages in each volume were calculated. Changes in colour were detected using Fourier Descriptors, in other words the coefficient numbers of Fourier Transform defined as below:
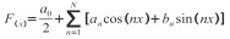
Any curves are denoted as infinite summations of two trigonometric function having coefficient of a and b (Fourier Series), and ordered earlier coefficients reflect major changes (lower frequency component), while ordered later coefficients reflect minor changes (higher frequency component) in the curve. Fourier Descriptors are finite version of Fourier Series. In this study, Fourier Descriptors were derived from Fast Fourier Transforms (FFT).
In contrast to the FFT, entropy was used to measure complexity of the magazine (Shannon 1948). Entropy is denoted as below:
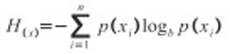
Here, H(x) is the average information content, the so-called entropy, of a series of random variable x, and p denotes the probability mass function of x. Therefore, p(xi) shows occurrence ratio of each luminance value of RGB. b specifies the unit of entropy, and 2 (bit) was used in this study. Using entropy, information content in each volume was described as composite index of pages and colours. Finally, changing points of the shift in entropy were detected by Bayesian Changing Point (BCP) method (Barry & Hartigan 1993).
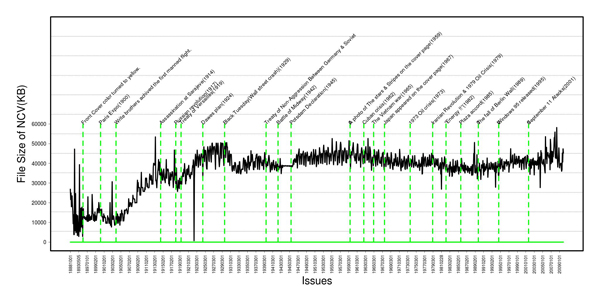 Figure 3: Comparison with information content and historical events
Results
The results of these analyses were compared to historical events and tenure of chief editors (Figure 3). First, the shift in file sizes seemed to be related to historical events. The first peak was detected around 1913 after which the curve of information content was decreased until 1919. The curve fit neatly with the duration of World War I. Afterwards, information content rapidly increased until the Wall Street Crash of 1929, known as ‘Black Tuesday’, after which the curve nosedived. During World War II, the curve had small amplitude, and then the curve increased moderately up to the Cuban Missile Crisis in 1962. The curve was in a gradual decline until the Vietnam War ended. Although a peak was detected around 1979, the year of Iranian Revolution and Oil Crisis, the curve has been stable since then.
Second, the shift of entropy seemed to be related to the history of chief editors. The curve describing entropyover time was unstable until around 1916 (Figure 4). This unstable condition might reflect many challenges of foundational periods. Indeed, another analysis of colour distribution shape for cover pages shows
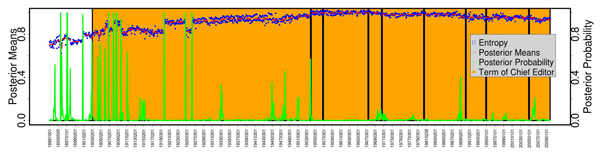 Figure 4: Changing point detection by Bayesian Change Point(BCP)
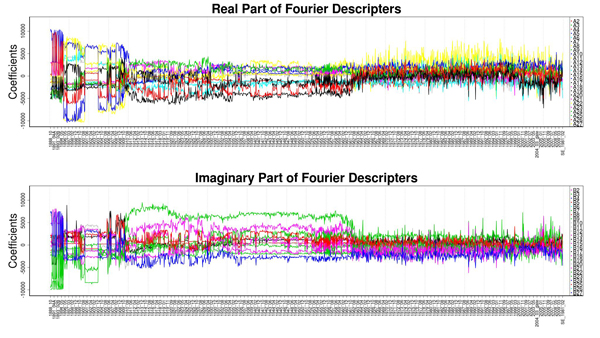 Figure 5: Temporal shift of Fourier Descriptors
similar tendency; although the cover page of NGM had no images at first, the illustrated cover pages had began around 1910 (Figure 5). After 1916, BCP of the shift of entropy was more stable than before, but small peaks appeared near the years in which chief editors changed.
Conclusion
The results derived from NCV analysis of the NGM seems to show a relationship to historical occurrences. That is, that NGM represents the conditions of the global society in some way. The results of any analyses should be more clear by overlapping them with these curves. On the other hand, the curves representing physical information content might not fit well with economic curves. Another question is, what does information content actually represent?
The results of these analyses are only a partial implementation of the schema I defined, and I would prefer to refrain from discussing any historical events with these results, under current circumstances. Our working group is currently collecting various kinds of materials, which may concerning NGM. As part of our future research, the author is planning to conduct text mining using the full text of the magazine, and to compare it to the results of this study.
Acknowledgement
This work was supported by Grants-in-Aid for geographic research of Fukutake Science & Culture Foundation (12-GEO-9).
References
Barry, D., and J. A. Hartigan (1993). A Bayesian Analysis for Change Point Problems. Journal of American Statistical Association 88(421): 309-319.
Hubbard, G. G. (1888). Introductory Address by the President. The National Geographic 1(1): 8-10.
National Geographic Society (2010). [DVD] The Complete National Geographic: National Geographic Society.
Price, W. (1942). Unknown Japan. The National Geographic 82(2): 224-252.
Shannon, C. E. (1948). A Mathematical Theory of Communication. Bell System Technical Journal 27: 379-423, 623-656.
Stevens, D. W. (1894). Japan. The National Geographic 4: 192-199.